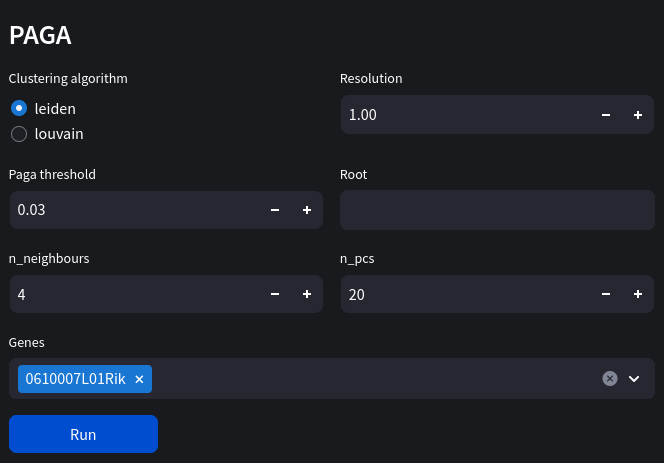
paga clustering
Computes a PAGA graph using louvain/leiden embeddings. View expression levels for individual genes across nodes of the graph. You may also recompute a scatter chart based on PAGA initialization.
Parameters
algorithm: str Clustering algorithm to using as PAGA groups.
resolution: float Resolution to use in clustering algorithm. A higher resolution produces more clusters.
threshold: float Do not draw edges for weights below this threshold. Set to 0 if you want all edges. Discarding low-connectivity edges helps in getting a much clearer picture of the graph.
root: str | int This is the index of the root node or a list of root node indices. If this is a non-empty vector then the supplied node IDs are used as the roots of the trees (or a single tree if the graph is connected). If this is None or an empty list, the root vertices are automatically calculated based on topological sorting.
n_neighbours: int The size of local neighborhood (in terms of number of neighboring data points) used for manifold approximation. Larger values result in more global views of the manifold, while smaller values result in more local data being preserved. In general values should be in the range 2 to 100.
n_pcs: int Number of PCs.
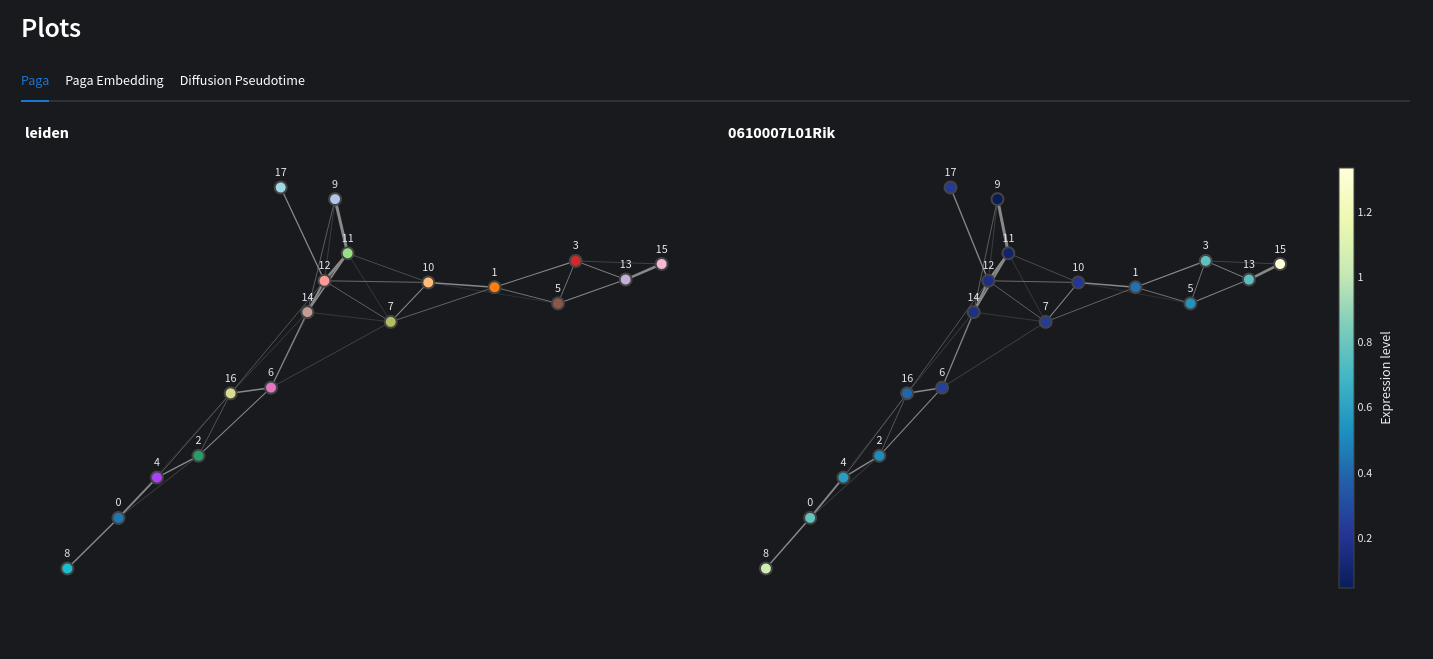
Web view
Python equivalent
import scanpy as sc
adata = sc.datasets.paul15()
# louvain cluster
sc.pp.neighbors(adata, n_neighbors=4, n_pcs=20)
sc.tl.louvain(adata, resolution=resolution)
# run PAGA
sc.tl.paga(adata, groups=algorithm)
sc.pl.paga(adata, color=['louvain', '0610007L01Rik'])
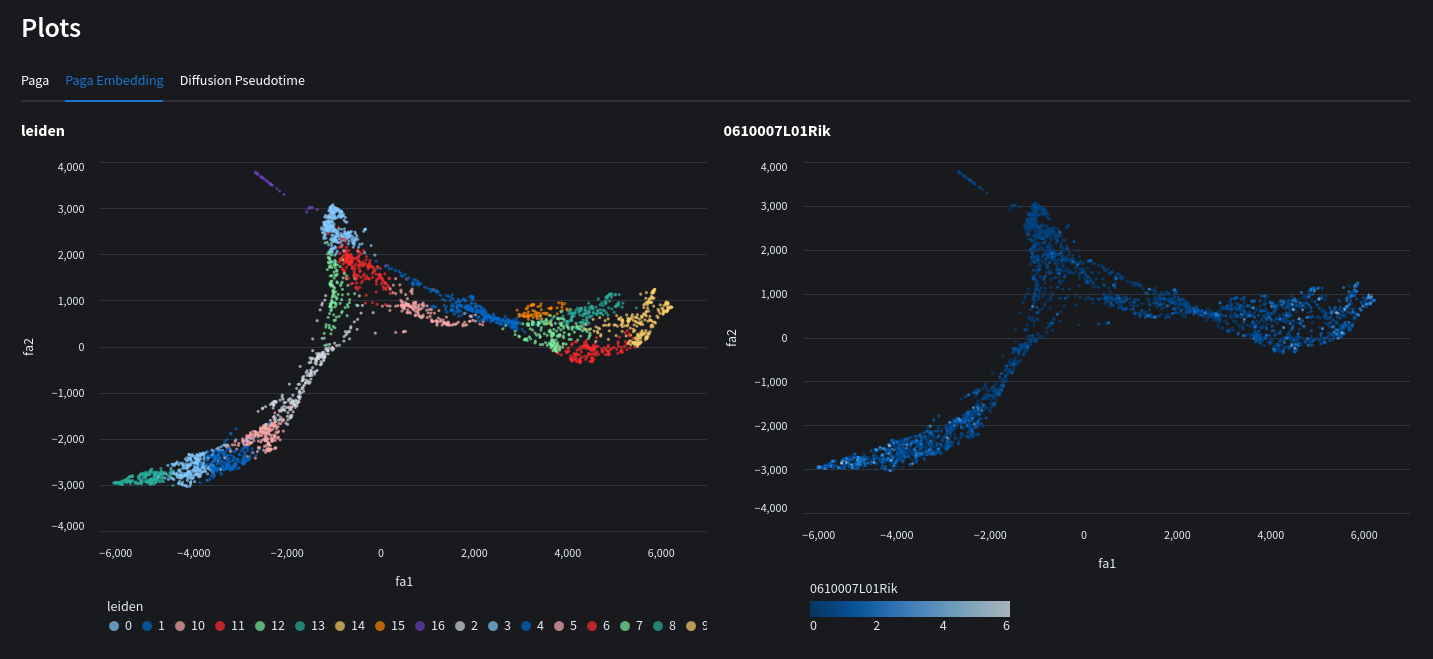
# recompute paga
sc.tl.draw_graph(adata, init_pos='paga')
sc.pl.draw_graph(adata, color=['louvain', '0610007L01Rik'], legend_loc='on data')