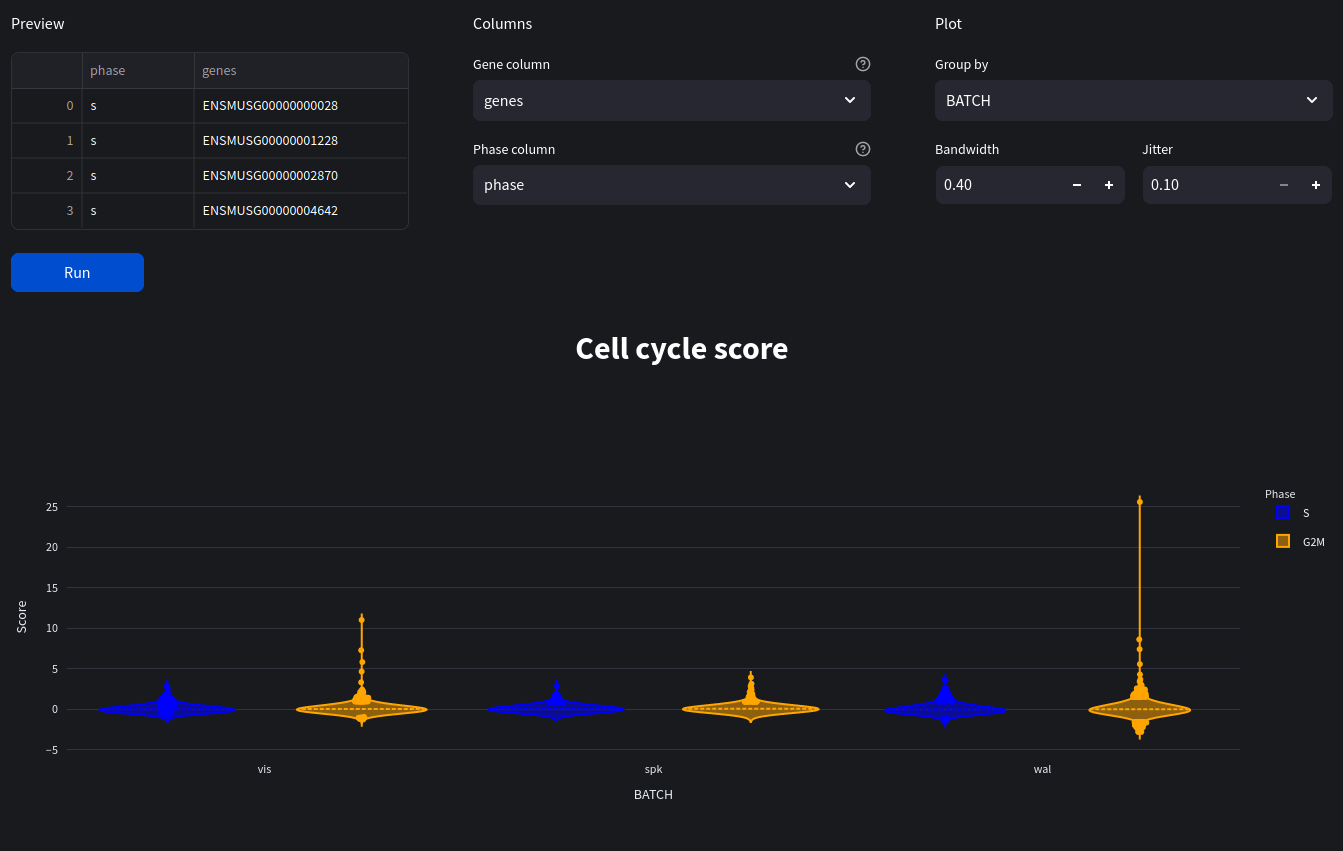
cell cycle scoring
Use marker genes to assign an S and G2/M score to approximate cell cycle distribution in dataset.
Parameters
cell_cycle_file: UploadedFile A csv or tsv file containing marker genes for S and G2/M phase.
gene_column: str The dataframe column name for the marker genes.
phase_column: str The dataframe column name for the phase.
group_by: Optional[str] The name of the obs value to group by when plotting.
bandwidth: float The bandwidth of the violins (a higher value increases the width of each violin).
jitter: float The offset of points on the violin plot.
Web view
Python equivalent
import scanpy as sc
import pandas as pd
import plotly.graph_objects as go
import numpy as np
import re

df = pd.read_csv("./mus_musculus_cell_cycle.csv", delimiter=',', index_col=0)

phase_column_index = 0
gene_column_index = 1

s_genes = df.iloc[:, phase_column_index].str.contains("s", flags=re.IGNORECASE, regex=True)
g2m_genes = df.iloc[:, phase_column_index].str.contains("g2m", flags=re.IGNORECASE, regex=True)

s_genes = df[s_genes].iloc[:, gene_column_index].values
g2m_genes = df[g2m_genes].iloc[:, gene_column_index].values

# Apply processing
adata.raw = adata
sc.pp.normalize_per_cell(adata, counts_per_cell_after=1e4)
sc.pp.log1p(adata)
sc.pp.scale(adata)

# In this case group by batches
group_by = 'BATCH'

sc.tl.score_genes_cell_cycle(adata, s_genes=s_genes, g2m_genes=g2m_genes)

# Plot violin plot
fig = go.Figure()

s_score_df = pd.DataFrame({'phase': np.repeat('S_score', len(adata.obs['S_score'])), 'score': adata.obs['S_score']})
g2m_score_df = pd.DataFrame({'phase': np.repeat('G2M_score', len(adata.obs['G2M_score'])), 'score': adata.obs['G2M_score']})

violin_df = pd.concat([s_score_df, g2m_score_df])

violin_df["group"] = adata.obs[group_by]

fig.add_trace(go.Violin(x=violin_df['group'][violin_df['phase'] == 'S_score'],
    y=violin_df['score'][violin_df['phase'] == 'S_score'],
    legendgroup='S', scalegroup='S', name='S',
    bandwidth=0.4, jitter=0.1, line_color='blue')
)

fig.add_trace(go.Violin(x=violin_df['group'][violin_df['phase'] == 'G2M_score'],
    y=violin_df['score'][violin_df['phase'] == 'G2M_score'],
    legendgroup='G2M', scalegroup='G2M', name='G2M',
    bandwidth=0.4, jitter=0.1, line_color='orange')
)

fig.update_traces(meanline_visible=True)
fig.update_layout(violingap=0, violinmode='group', xaxis_title=group_by, yaxis_title="Score", legend_title="Phase") #add legend title
fig.show()