filter highest expr genes
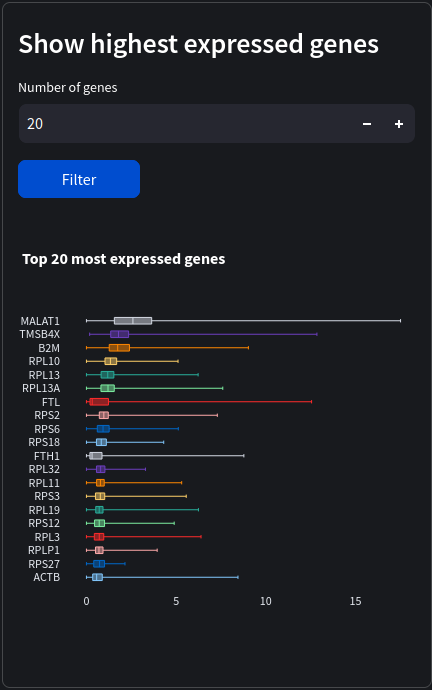
Fraction of counts assigned to each gene over all cells. Computes, for each gene, the fraction of counts assigned to that gene within a cell. The n_top genes with the highest mean fraction over all cells are plotted as boxplots.
Parameters
n_top_genes: int Number of top gene symbols to show.
Web view
Python equivalent
import scanpy as sc
sc.pl.highest_expr_genes(adata, n_top=20)