scvi integrate graphs
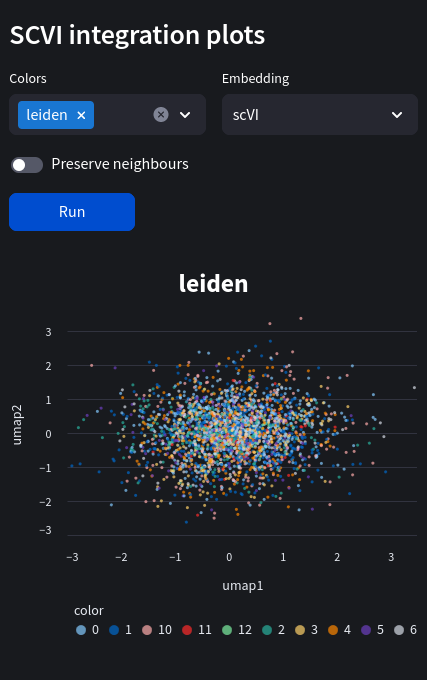
Plot integrated dataset with scVI or scANVI embeddings.
Parameters
colors: str Key for colour.
embedding: str Embedding to choose from.
preserve_neighbours: bool Uses minimum distortion embedding (MDE) to minimally distort relationships between pairs of items, while possibly satisfying some constraints.
Web view
Python equivalent
import scvi
import matplotlib.pyplot as plt

# .. Do integration with scvi or scanvi

# in this example we use scvi embeddings

scvi_df = pd.DataFrame({'umap1': adata.obsm['X_scVI'][:,0], 'umap2': adata.obsm['X_scVI'][:,1], 'color': adata.obs[color]})
scvi_df_mde = pd.DataFrame({'umap1': adata.obsm['X_scVI_MDE'][:,0], 'umap2': adata.obsm['X_scVI_MDE'][:,1], 'color': adata.obs[color]})

fig, (ax1, ax2) = plt.subplots(1, 2)
ax1.scatter(x=scvi_df['umap1'], y=scvi_df['umap2'], color=scvi_df['color'])
ax1.title('scvi embedding')
ax1.xlabel('umap1')
ax1.ylabel('umap2')
ax2.scatter(x=scvi_df_mde['umap1'], y=scvi_df_mde['umap2'], color=scvi_df_mde['color'])
ax2.title('scvi embedding with MDE')
ax2.xlabel('umap1')
ax2.ylabel('umap2')