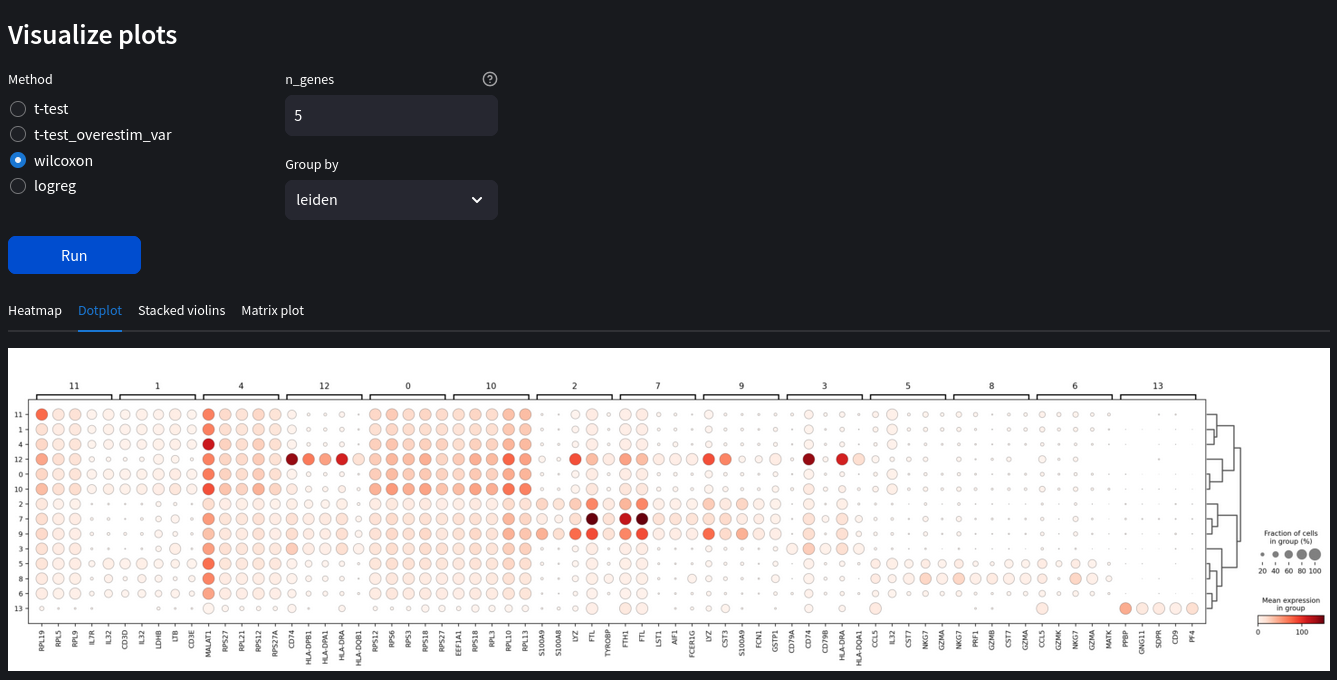
visualize
Visualize differential expression between individual genes or clusters.
Parameters
method: str Statistical test to find differential clusters and results in adata for plotting. Options include t-test, t-test_overestim_var, wilcoxon and logreg.
n_genes: int Number of genes in each cluster.
group_by: str Name of cluster group.
Web view
Python equivalent
import scanpy as sc