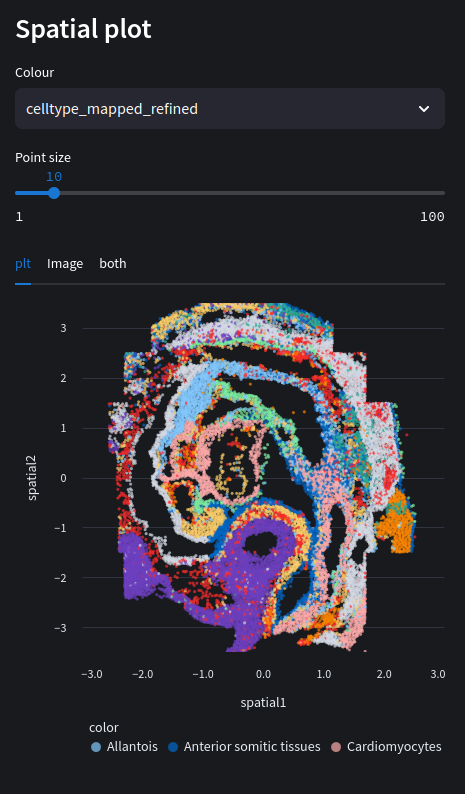
spatial scatter
Plot a spatial graph. Optionally overlay on histology image if available.
Parameters
color: str Obs value to color samples.
point_size: int Size of markers in scatter graph.
Web view
Python equivalent
import squidpy as sq

sq.pl.spatial_scatter(adata, color="celltype_mapped_refined", shape=None, figsize=(10, 10))