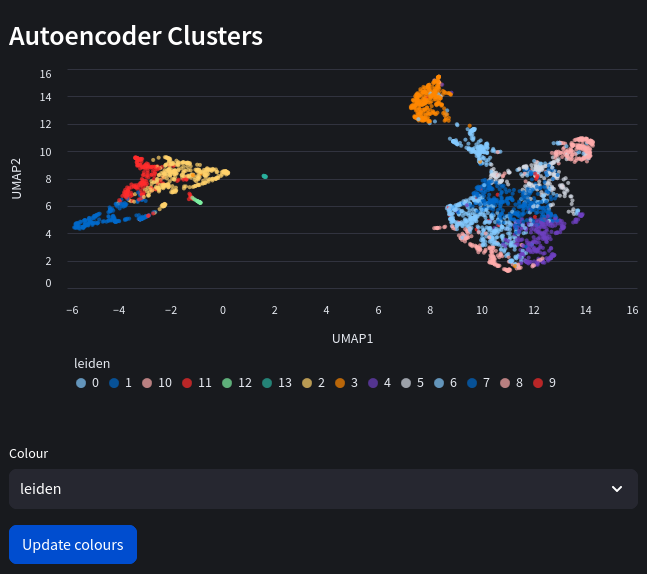
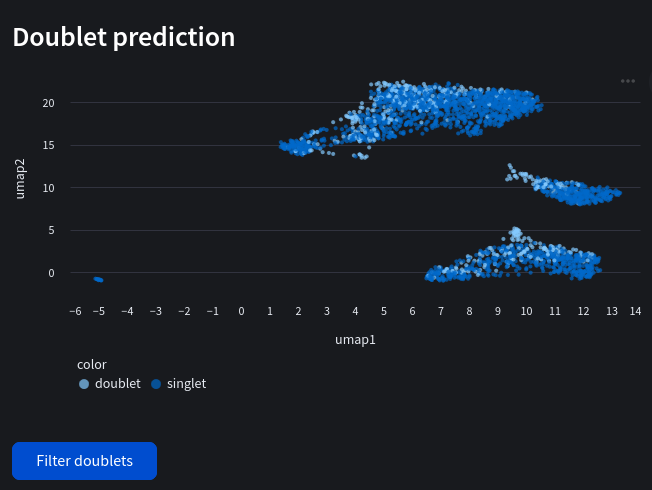
autoencoder cluster plot
Scatter plot showing embeddings for trained model.
Parameters
color: str Colour based on an obs value (available for citeseq autoencoder).
Web view
Python equivalent
# For Citeseq see https://nuwa-genomics.github.io/Nuwa/reference/Create_CiteSeq_model/init_model.html#python-example

# For Solo see https://nuwa-genomics.github.io/Nuwa/reference/Create_Solo_model/init_model.html#python-example