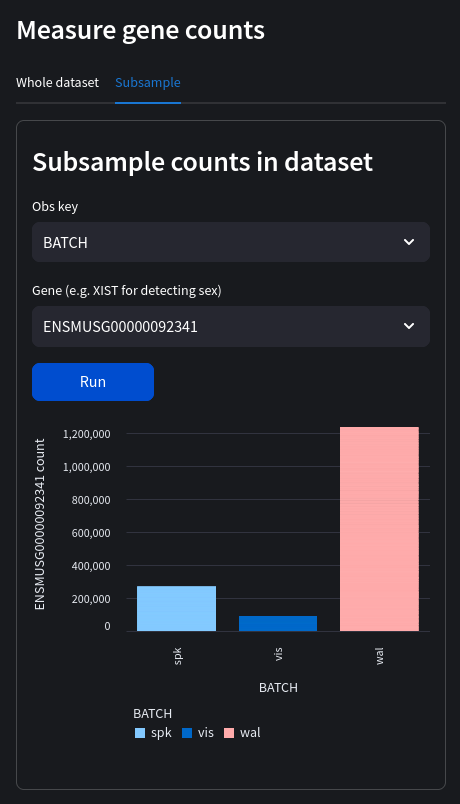
measure gene counts
Measure counts of genes within the whole dataset or compare across cell populations by supplying an obs key.
Parameters
gene: str The gene name to measure.
obs_key: str Name of observation. This will measure gene counts within a sub-population.
Web view

Python equivalent
import scanpy as sc
import matplotlib.pyplot as plt
import numpy as np
import pandas as pd

fig, ax = plt.subplots()

# subset of counts in observation
fig, ax = plt.subplots()

gene = 'ENSMUSG00000092341'
obs_key = 'BATCH'
df = pd.DataFrame({f'{gene} count': adata.to_df()[gene], f"{obs_key}": adata.obs[f"{obs_key}"]})
ax.bar(df[f'{obs_key}'], df[f'{gene} count'])
plt.title(f'Gene counts across {obs_key}')
plt.xlabel(f'{obs_key}')
plt.ylabel(f'{gene} count')
plt.show()
