ripley score
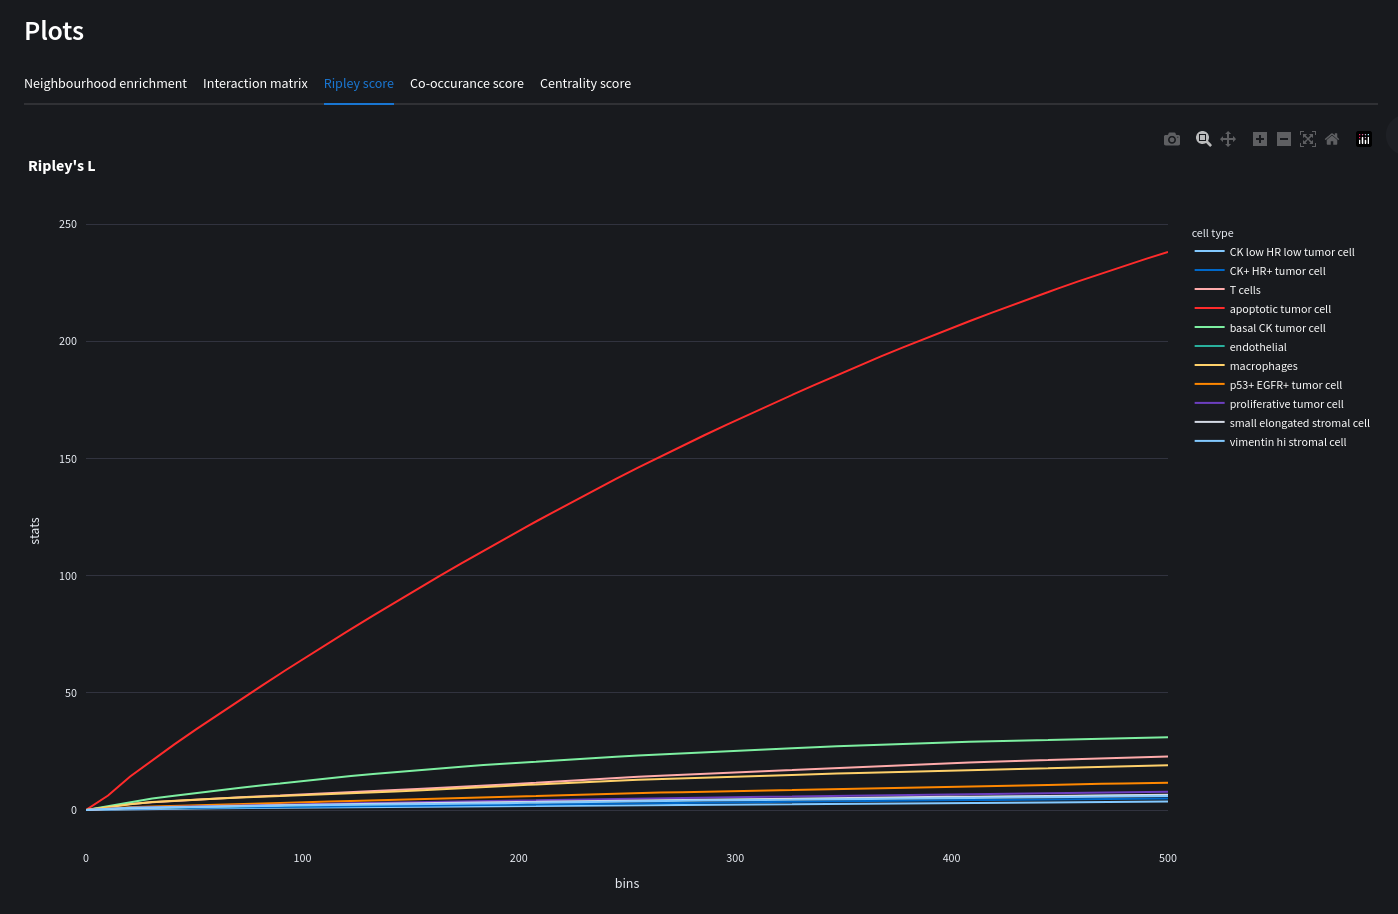
In addition to the neighbor enrichment score, we can further investigate spatial organization of cell types in tissue by means of the Ripley's statistics. Ripley's statistics allow analyst to evaluate whether a discrete annotation (e.g. cell-type) appears to be clustered, dispersed or randomly distributed on the area of interest.
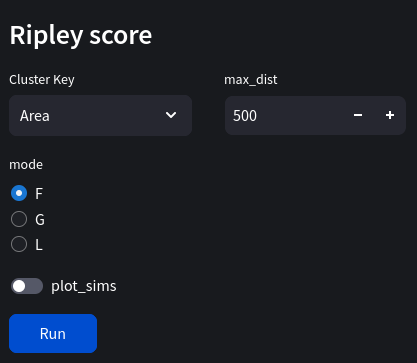
Parameters
cluster_key: str Key by which to compute neighbouhood enrichment scores.
max_dist: int Maximum distance between spatial clusters.
n_neighbours: int Number of neighbours.
n_simulations: int Number of simulations.
mode: char Ripley mode (F, G or L).
plot_sims: bool Plot simulations.
Web view
Python equivalent
import squidpy as sq

mode = "L"
sq.gr.ripley(adata, cluster_key="cluster", mode=mode, max_dist=500)
sq.pl.ripley(adata, cluster_key="cluster", mode=mode)